Author: Anil Nayak, Software Developer
The importance of logs is nothing new to a software engineer. Almost every application today runs in a server environment, which results in generating logs automatically. Those logs act as a critical part of any system by providing you the insight to understand how the system is operating currently and in the past and how to debug a bug in the code. To perform logging, we had an in-house single-server logging system, performing the following logging processes:
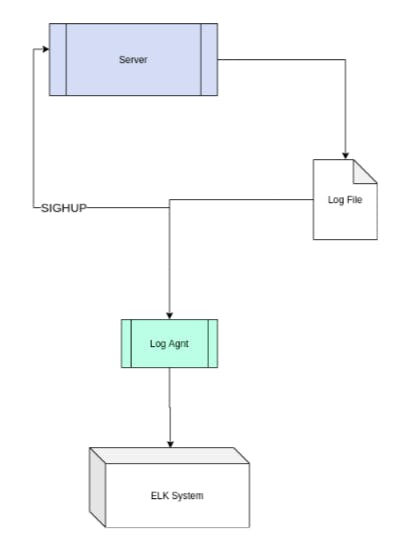
Single-server logging

SIGHUP signal is a command to a process when the controlling terminal is closed.
- Creating log files: When the application runs on the server, it creates log files containing all the log data.
- Rotating log files: The log rotation process starts with sending the SIGHUP signal to the server to rotate the log files. When the SIGHUP signal is sent to the server, the server deletes an existing log file (for example auth.log file is deleted) and creates a new log file (for example, creating auth.log) to log new entries.
Sending log data to Log Agent: When the log files are created, the Log Agent reads the log data and sends the logs to the ELK system.
Processing and visualizing the log data: The ELK system analyzes and processes the log data received from the Log Agent. It also works as a storage for the log data. In the Elasticsearch interface, you can use Kibana for data visualization in graphs and chart forms and for exploration support.
In our single-server logging, the logs are generated in local files form. However, when we started expanding and when the need of multiple servers occurred to serve the high number of requests, managing the logs in the form of local files became complicated. Due to this complication, we started thinking of different approaches to manage the logs from multiple servers. Also, we started creating microservices so that we can manage the logs coming from different types of servers and containing different programming languages.
One of the common and effective approaches for such complications is working with a centralized logging system. A centralized logging system aggregates all the log data and moves the data to a central and easy-to-use location. It not only collects the log information easily but also helps in analyzing and visualizing the data quickly.
The capabilities of a centralized logging system include:
- Storing logs from multiple sources to a single storage location
- Performing an easy search in the log files to get specific information
- Backing up the historical log information
- Sharing log information with others easily
Also, to pull off all the requirements of managing different types of servers along with the programming languages, we used the approach of using docker containers in our centralized logging system. The docker containers not only provide a predictable application environment, but also simplify the deployment process for the application. And being an easy-to-manage and scalable aspect is a plus for docker containers.
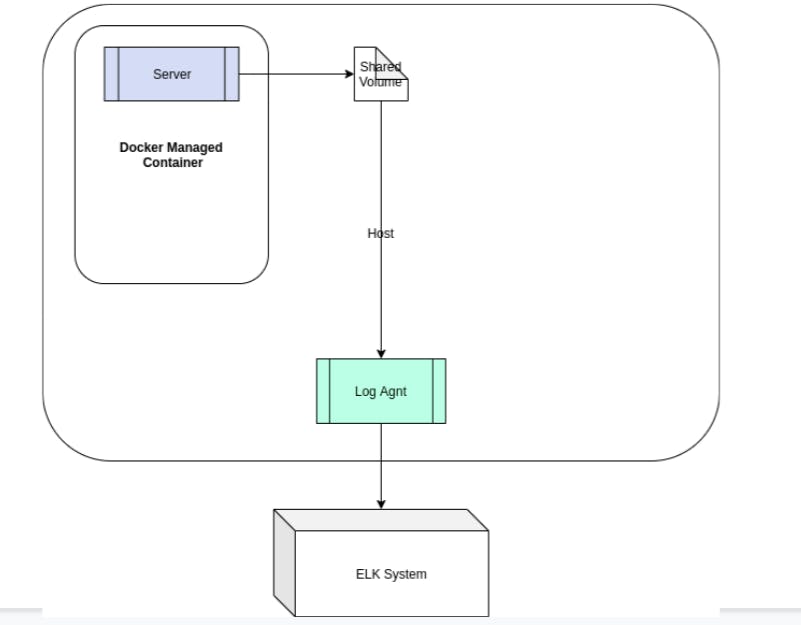
When we extended our logging system from a single-server to multiple servers using docker containers, the following components were added to the centralized logging system:
Centralized Logging System architecture for multiple servers

Docker Managed Container: Docker managed container is an isolated controlled environment that packages all the dependencies (for example, server(s)) to run your application.
Shared Volume: Shared volume is storage for log files that are shared between Log Agent and the server.
Log Agent: Log Agent reads logs from the Shared Volume and sends the logs to the ELK system.
ELK System: ELK stands for Elasticsearch, Logstash, and Kibana. This system provides the capability of processing, storing, and visualizing the log data.
Elasticsearch: This is an engine that stores the processed log data coming from Logstash.
Logstash: This is a data processing pipeline that processes the log data and sends the data to a stash such as Elasticsearch.
Kibana: This enables you to see the data in graphical and chart forms.
However, in our centralized logging system, the docker container started breaking the logging process, which is considered as a stumbling block. As you see in the previous figure, the Log Agent is placed outside the docker container, which fails the process of sending the SIGHUP signal to the server to rotate the log files.
Summing it up
In order to manage the logging, we started with a single-server logging system, which further extended to multiple servers, when we started expanding and extended to logs from multiple servers. For managing the logs from multiple servers, we started using our centralized logging system, containing docker managed containers. However, the centralized logging system consisting of docker containers is failing to rotate the log files due to the placement of the Log Agent in the architecture.
Thus, what can be the solution?
Do we need to change the placement of the Log Agent or there can be any other solution?
Let’s discuss that in our next post.


